June 2023 | Volume XLI, Issue 2 »
Science on a Sphere - Another Tool for Visualization and Instruction
June 1, 2023
Meredith Ayers, Northern Illinois University
Technology is rapidly changing the way people learn about and view the world. The University of Illinois at Urbana-Champaign Grainger Engineering Library’s Immersive Learning Lab make virtual reality accessible, and the Visualization Theater takes presentations to the next level.(1) The University of Illinois Chicago’s Electronic Visualization Laboratory has an Interactive Spherical Display developed by Pufferfish.Ltd.(2) It is a sphere that acts like a touch screen so people can interact and learn about the data being displayed just by touching it. Even though this sphere is not touchable, the 191st Science on a Sphere exhibit recently installed at Northern Illinois University (NIU) in March 2022 is still impressive. The Science on a Sphere (SoS) patent is owned by the National Oceanographic and Atmospheric Administration (NOAA) and SoS, found in 23 countries and 33 states(3), is a spherical data visualization tool on which GIS/GPS tagged data can be projected for educational purposes. The state of Illinois now has two Science on a Sphere Exhibits. One at the Museum of Science and Industry in Chicago and now the one in Founders Memorial Library at NIU in Dekalb, IL.(4)
THE SETUP
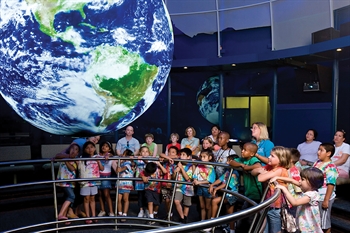
A six-foot diameter sphere is suspended from the ceiling with a guard railing below to prevent people from getting too close, touching it, or hanging out underneath the sphere. There are four strategically placed, ceiling mounted projectors that project images onto the sphere. This also includes an audio system for narrated presentations. A hardware cabinet contains all the electronics, cables, and the operational computer for running the projectors and programs on the sphere. Also included is a handheld iPad remote control with a user-friendly interface to make running preloaded programs on the sphere easy and accessible to larger groups of people without programming knowledge. The sphere also has specific power and internet needs to run properly. More technical specifications for the sphere can be found on the NOAA’s website.(5)
THE PROGRAMS
There are over 600 data sets to choose from in the NOAA Science on a Sphere’s searchable catalog.(6) The search box performs a basic string search so spelling, accurate typing, and correct terminology are a must. It can also be sorted by pre-determined category, subcategory, keyword, theme, grade level, cross-cutting concepts, or disciplinary core ideas. There are lots of ways to explore and get to the data you are looking for. There is also a “Select a platform” option in which the searcher can choose Science on a Sphere or Explorer, another presentational platform available from the NOAA.
Among the most obvious uses for the sphere is the study of weather patterns, climate models, ocean currents, albedo, geography, air pollution, precipitation, ozone, etc. A student studying the geography or geology of one of Saturn’s moons could present their findings and defend their thesis or dissertation using the satellite footage projected on a 3-D sphere. Earthquake locations and size can be viewed in real time and across time. Land use and vegetation patterns on the continents, location and movement of tectonic plates, tsunami paths and development, and animal migration patterns can all be studied on the sphere as long as the data set exists. You can view the growth and recession of the polar ice sheets and glaciers over time across the globe. Astronomy students can view the night sky much like viewing a star globe.
However, it is good for studying or viewing other data as well. Remember those 2D maps in the back of inflight magazines that showed all those curved flight paths for commercial airplanes? It all makes perfect sense when projected onto a curved surface with rotation. The same can be done with commercial shipping routes. Communication students can study the connectivity of people across the globe by viewing the data of Facebook Friendships. Health Science professionals can view the potential risk of contracting diseases like malaria around the globe. Anthropologists can view data on population densities while sociologists can study the displacement of people due to flooding over time.
The sphere also has narrated presentations. An Environmental Studies group could view a presentation about sustainable agriculture. K-12 classes could come and watch one of the ClimateBits and learn about various environmental topics like solar radiation, UV index, El Niño, Carbon Dioxide, or Urban Heat Islands. Historians can view a presentation of cities through time. There are presentations on space exploration, fresh water, climate change, pollution, oceans, life, and using satellites to study the earth just to name a few.
PRESENTING ON THE SPHERE
Presentations are done using the iPad remote control. Using the iPad, the presenter can select the data set from the pre-loaded playlist to start the presentation. The presenter can pause, fast forward or slow down the presentation speed. The image on the sphere can be manually rotated by the presenter up, down, and side to side. There is an annotation feature that provides the presenter with a pointer and a marker to circle or write on the sphere. The other presentation features include zoom and split. With these, the presenter can zoom to specific data points on the sphere; split the view 2, 3, or 4 ways so everyone around the sphere can see the same point, and use the annotate feature to highlight the data. Afterwards, the presenter can turn off these features to continue the presentation.
CURRENT USES AND POTENTIAL USES
When the SoS is not being used for an active presentation, it runs a preprogramed playlist showing as many kinds of data as possible. The most exciting, but also a complicated potential use of the sphere, is for faculty, students, and staff to show their own research on the sphere. Each data point must have GIS/GPS coordinates to be displayed but that is not enough. Most programs are designed to display points on a flat 2D surface. The data first needs to be run and manipulated in a special program so it can be displayed properly on a curved surface. It is this part of the process which requires some programming skills and knowledge. NIU Libraries is currently looking to hire a graduate assistant from the Computer Science Department on campus with the necessary skills to assist researchers with this process and is looking for a way to formalize the process to make it readily available to anyone interested in projecting their data on the sphere.
COLLABORATORS WELCOMED
NIU Libraries has already begun collaborating with instructors on campus to use the sphere for instruction as well as local community members for programs and presentations done on the sphere. NIU Libraries staff have even started creating local data sets for the sphere such as Huskies’ hometowns which marks all the hometowns of our current student population from all over the world.
REFERENCES:
1. Illinois University Library. “Spaces- Grainger Engineering Library Information Center-U of I Library.” Accessed March 24, 2023. http://www.library.illinois.edu/enx/idea-lab/spaces/.
2. University of Illinois Chicago. “evl l Interactive spherical Display Open House at EVL.” Accessed March 24, 2023. http://www.evl.uic.edu/events/2687.
3. National Oceanic and Atmospheric Administration (NOAA). “History of Science On a Sphere.” Accessed March 24, 2023. https://sos.noaa.gov/sos/history/.
4. National Oceanic and Atmospheric Administration (NOAA). “Location-Science On a Sphere.” Accessed March 24, 2023. https://sos.noaa.gov/sos/locations/#united-states.
5. National Oceanic and Atmospheric Administration (NOAA). “Technical Specifications.” Accessed March 24, 2023. https://sos.noaa.gov/sos/getting-sos/technical-specifications/.
6. National Oceanic and Atmospheric Administration (NOAA). “Dataset Catalog.” Accessed March 24, 2023. https://sos.noaa.gov/catalog/datasets/.
 iREAD Summer Reading Programs
 Latest Library JobLine Listings